Running Pentests
Learn how pentests work, how to start them, and monitor progress
How Pentests Work
Every pentest is built on your asset map. Three agent roles turn a URL into a fully tested graph:
- Reconnaissance crawls your application and builds the asset map — pages, endpoints, services, and how they connect.
- The auditor reads the whole graph and decides what's worth attacking, emitting prioritized investigations.
- Provers confirm each investigation by actively exploiting it, then chain from what they confirm.
This works the same whether your application exposes a web surface, an API surface, or both — every page and endpoint becomes a node on one shared map.
Pentest duration varies based on application size. A small API might complete in 10-15 minutes, while a large web application could take 30-60 minutes.
Starting a Pentest
- Go to the Applications page
- Find your application card
- Click Start Pentest
- You'll be redirected to the pentest monitoring page
Each application can only have one pentest running at a time. Complete or wait for the current pentest before starting another.
Monitoring Progress
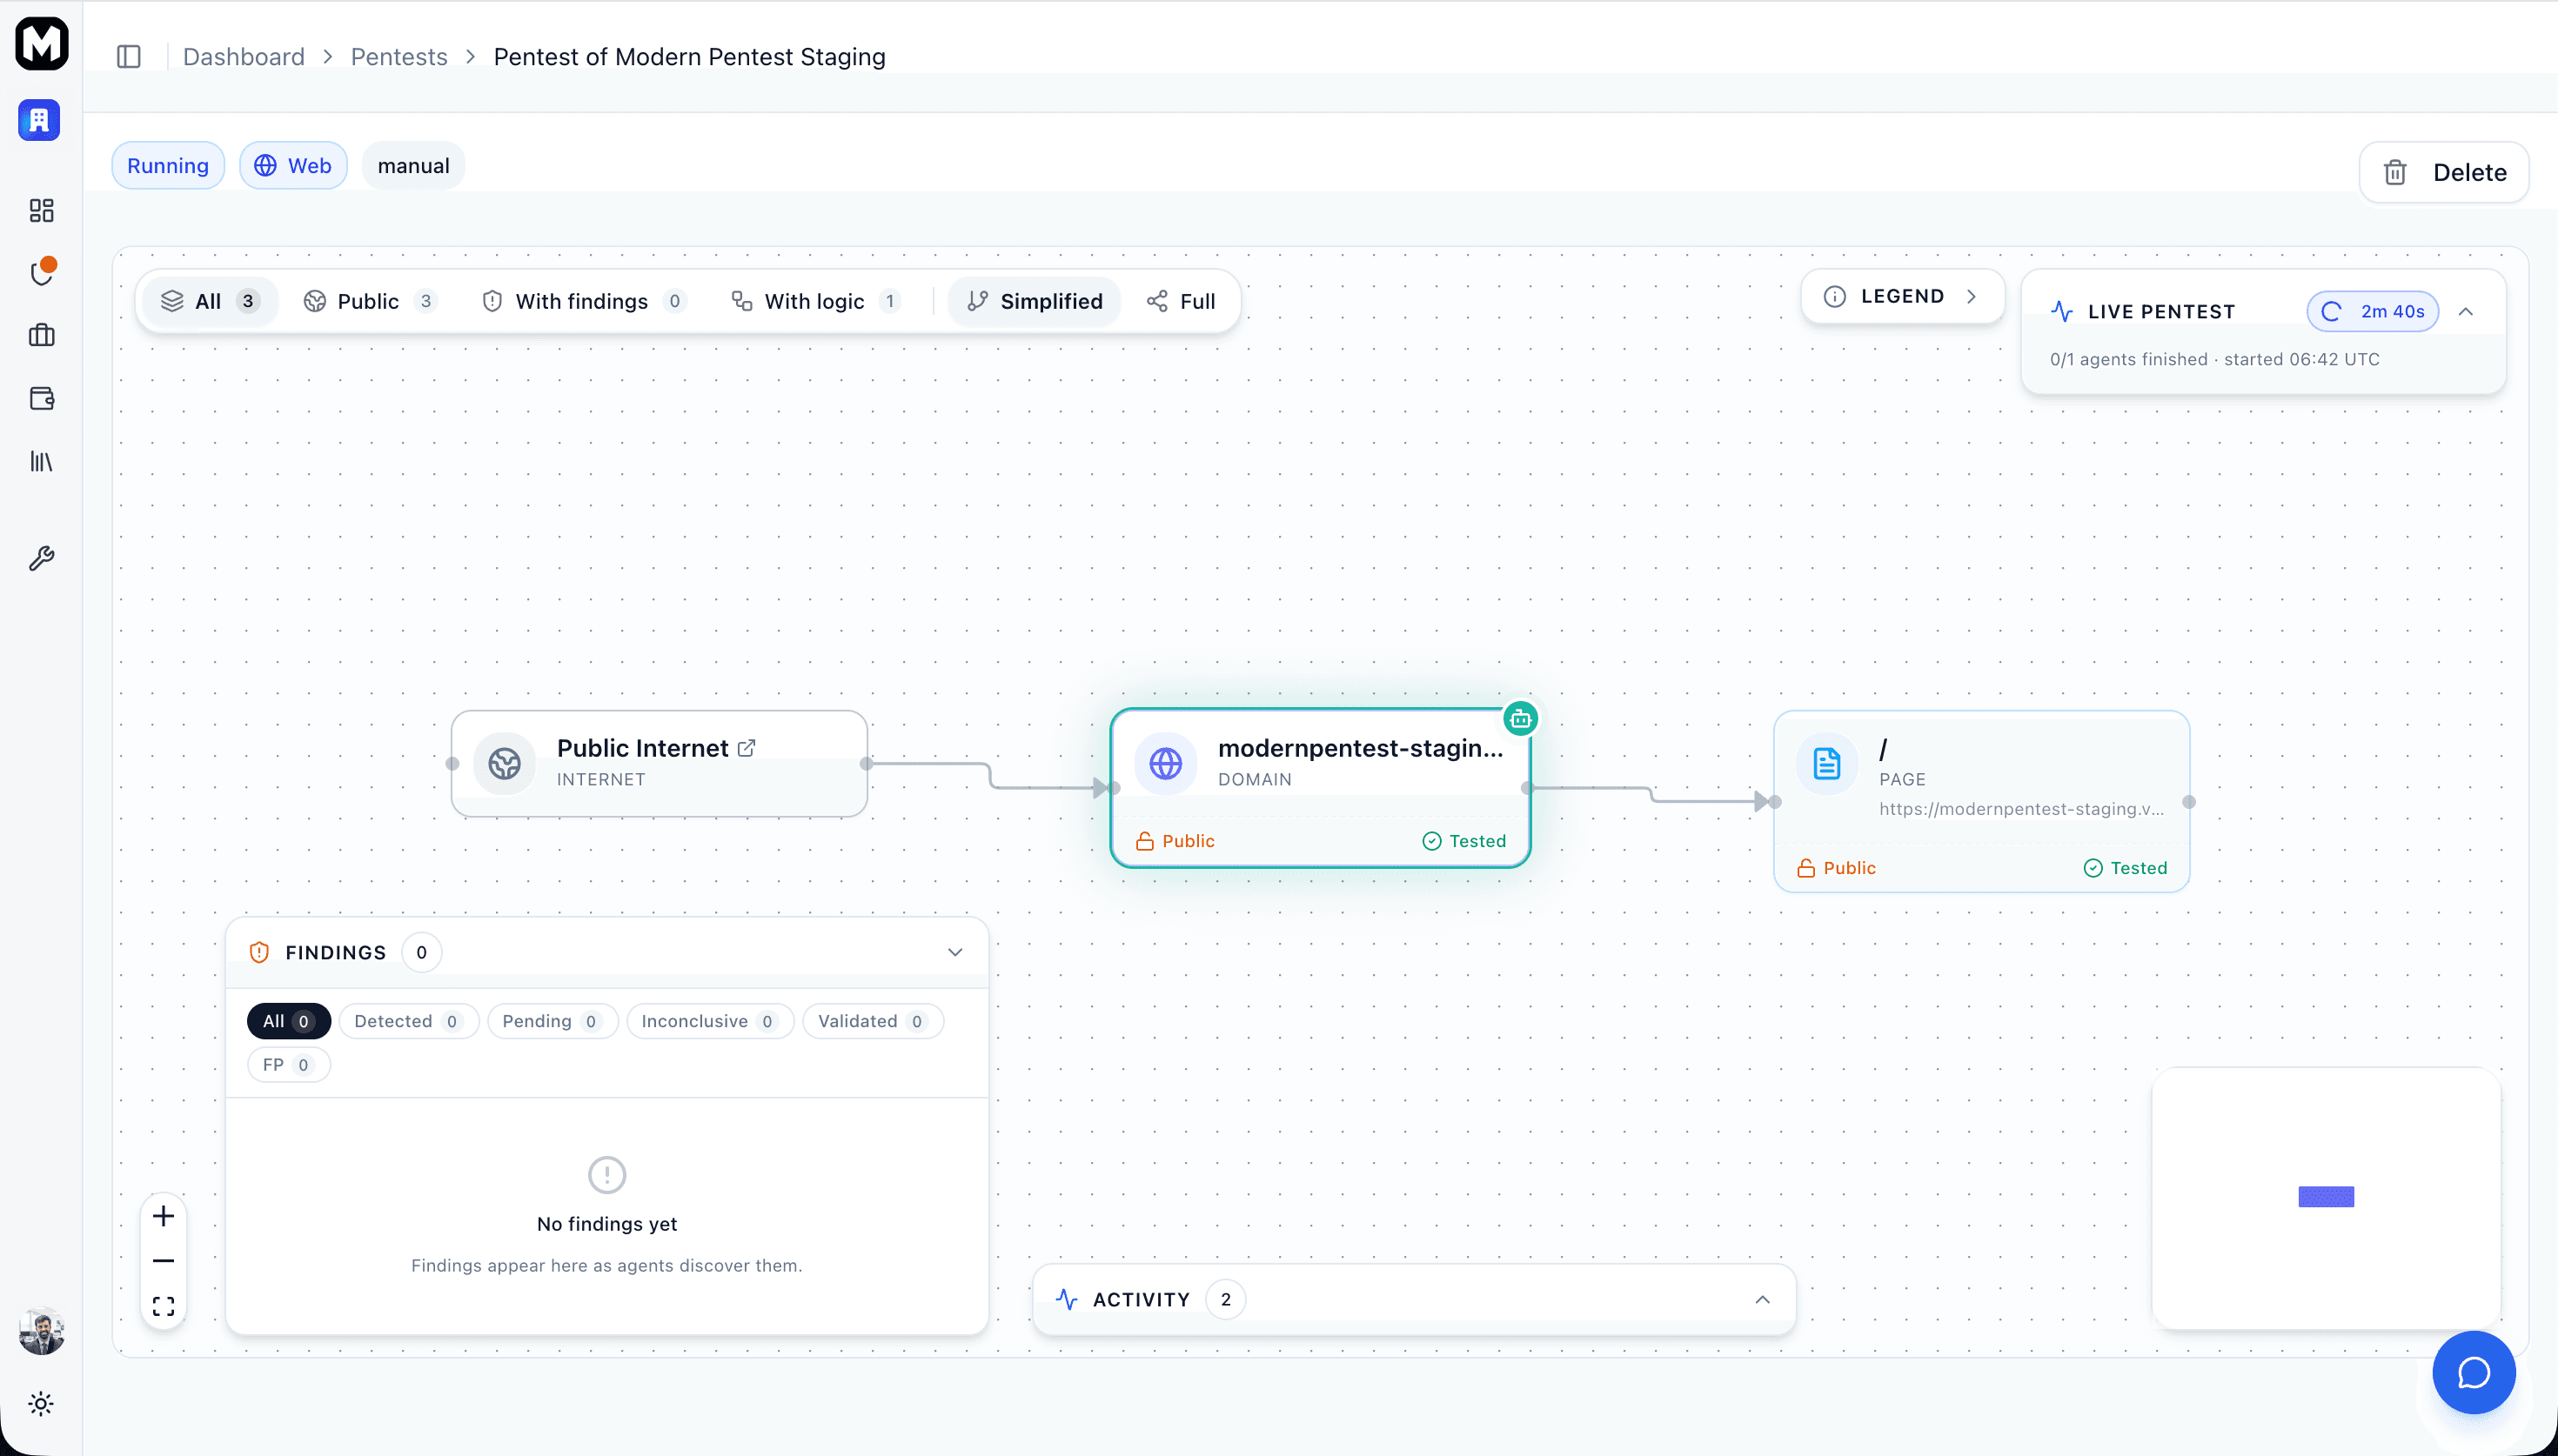
Once started, monitor your pentest in real-time on the pentest detail page. The centerpiece is your asset map in its live lens: agent avatars move across the graph as recon, the auditor, and provers work, and findings pulse on their node the moment a prover confirms one.
Switch the demo below to Live scan to see how it looks:
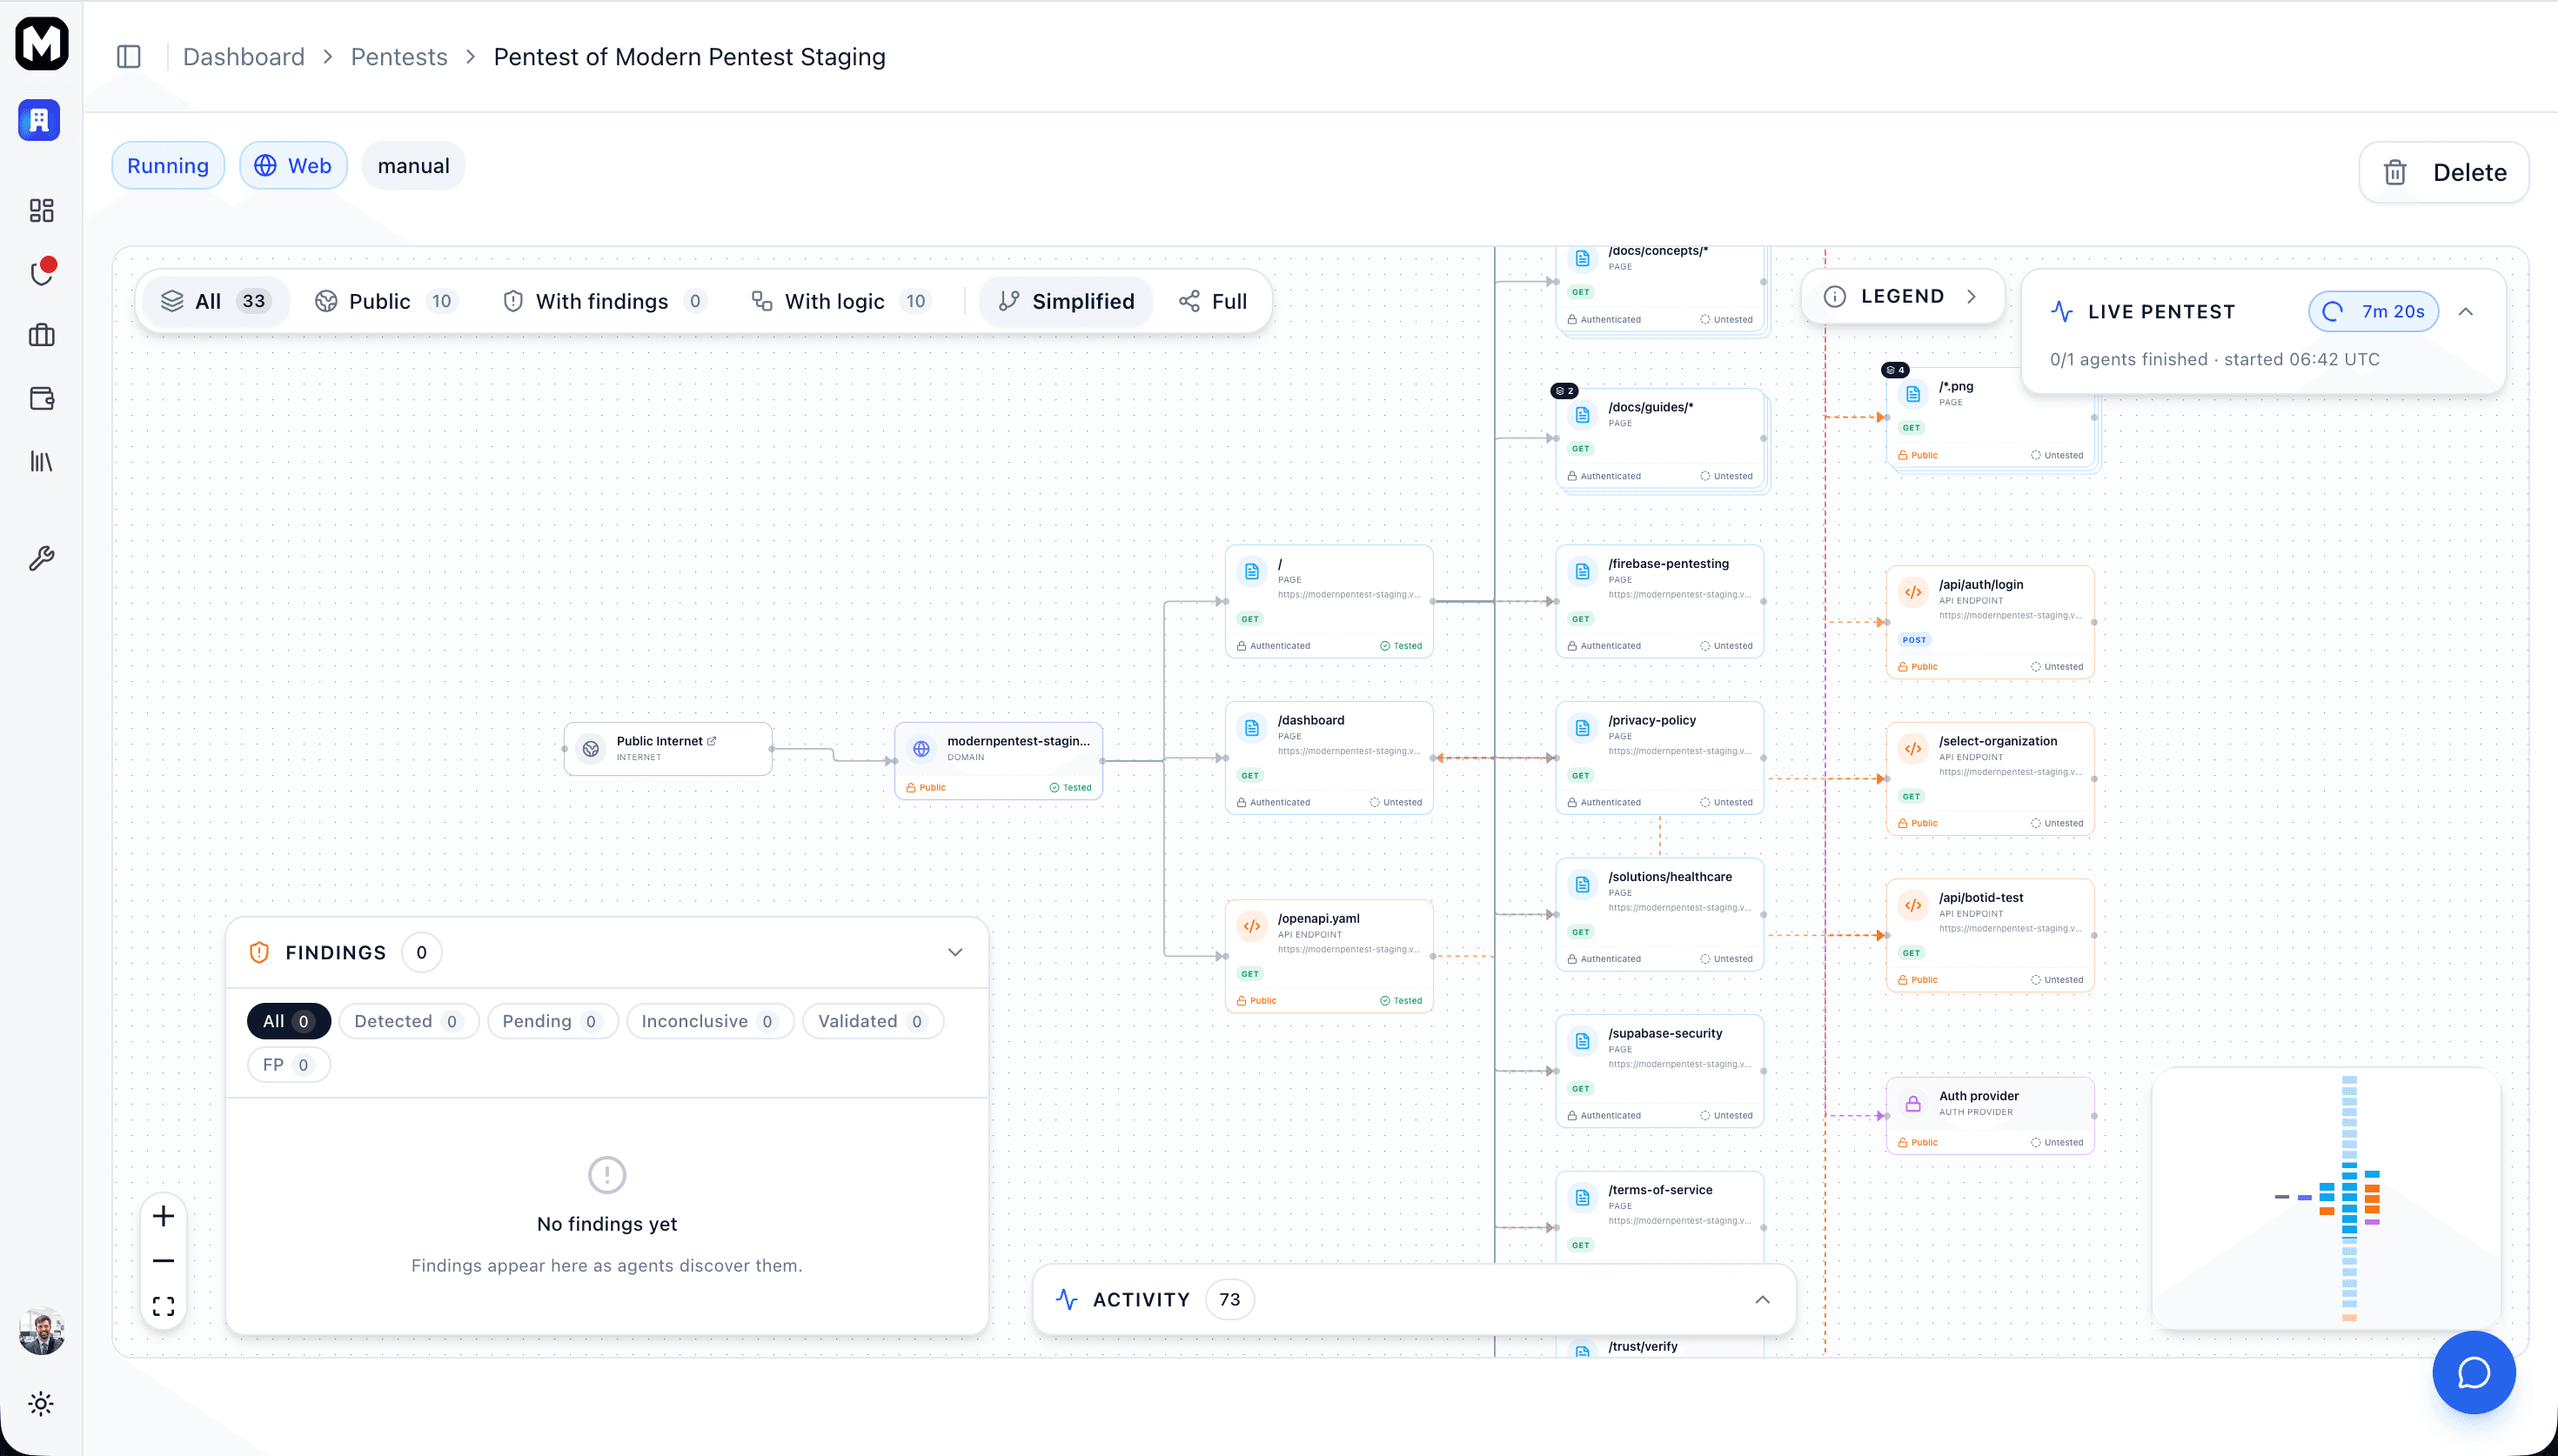
The full topology after recon — every asset and how it connects. Color shows test coverage and findings.
The live dashboard
While a pentest runs, the asset map shows:
- Current status - Pending, Running, Processing, or Completed
- Agent avatars - Which agents are testing, scheduled for, or done with each node
- Agent activity - A real-time rail of distilled events — discoveries, findings, status changes
- Live findings - Vulnerabilities pulsing on their node as provers confirm them
Agent Pipeline
Each pentest runs through four phases:
-
Reconnaissance
- Crawls your application and builds the asset map
- Identifies technologies, services, and authentication flows
- Records discovery blockers where it can't reach further
-
Auditing
- The auditor reads the whole graph and emits prioritized investigations
- Focuses effort on the highest-value, highest-risk assets
-
Proving
- Provers confirm each investigation by actively exploiting it
- Findings appear in real-time as they're confirmed
- Confirmed findings chain back to the auditor for deeper attacks
-
Processing & Complete
- Deduplicating, validating, and enriching findings with remediation
- Final prioritized vulnerability list and report generation
Understanding Pentest Results
After your pentest completes:
- Review the summary - See vulnerability counts by severity
- Prioritize findings - Focus on Critical and High severity first
- Read remediation guidance - Each finding includes fix recommendations
- Generate reports - Download for team review or compliance
For detailed guidance, see Understanding Reports.
Scheduled Pentests
Automated pentests run based on your configured frequency (daily, weekly, or monthly). You can view upcoming scans, reschedule them, or run them immediately from the Schedule page.
See Managing Schedules for details on viewing and rescheduling automated pentests.
Next Steps
Last updated: July 27, 2026